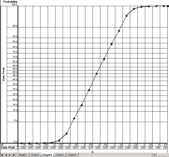
Create charts for probability distribution
2003-04-07 Charts 0 228
This addin creates simple "charts" for probability distribution (log-normal chart).
The "charts" uses an Y-axis with a scale that follows a normal probability distribution.
You can select a linear or logarithmic scale on the X-axis. Data that usually would be displayed as a normal bell-shaped curve will be displayed as a straight line in this "chart".
This tool does not use the built-in chart functions in Excel, but creates it's own "chart" on a worksheet.
Thanks to Joseph T. Forrest for valuable input and beta testing.

Click here to download this file.
Updated: 2003-04-07 Requires: XL97 File size: 99 kB Protected project